

Never Miss a Beat: Get a snapshot of the issues affecting the IT industry straight to your inbox.
Put to the Test: Oracle BI Enterprise Edition
Built on the federated data access and Web-based architecture of Siebel Analytics, Oracle's latest BI offering is competitive, but the admin and query interfaces could stand a few usability improvements.
9 Min Read

PROS |
• Powerful meta data layer with federated data access |
• Completely Web-based authoring tools |
• Interactive and integrated dashboards |
• Strong administrative capabilities |
CONS |
• Unintuitive tasks and interface in both Answers and the Administrative Tool |
• Prompting capabilities are limited and cumbersome |
• Lags pure-play vendors on recent innovations such as Office integration, BI Search, and Vista Gadgets |
Oracle acquired Siebel Systems in the fall of 2005 and with that acquisition, gained a powerful BI product in Siebel Analytics. Contrary to public perception, this BI product was never restricted to Siebel CRM data, and in fact, boasts one of the broadest data access capabilities of any BI suite vendor. In early 2006, Oracle rebranded Siebel Analytics as Oracle BI Enterprise Edition (EE). For long-time Discoverer or Reports users, these products have been positioned as the Standard Edition, with the vendor declaring ongoing support and product improvements.
This review focuses on the key components of Oracle BI EE and why this will be the vendor's flagship BI product even post Hyperion acquisition
Powerful Business Meta Data Layer
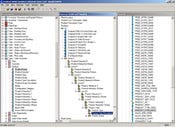
A key requirement for any business query tool is a metadata layer that shields users from the underlying complexities of physical table structures. Oracle BI EE delivers this via its "subject areas." Subject areas are built in the Administration Tool, a Windows-client shown at right. In building these subject areas, there are three components:
A physical layer that provides information to physical data sources such as connections, tables, columns and so on.
A business model or logical layer that provides capabilities such as hierarchical dimensions (for example Year to Quarter to Month), aggregation rules, calculations,
A presentation layer that shows the subject areas to the end users in Answers, the business query interface
I found the Administration Tool confusing, hindered by mediocre documentation.
Routine tasks are not apparent and can be convoluted. For example, in trying to determine how something in the presentation layer relates to the physical, you must first run a query and then navigate to the item. Meanwhile the relationship between these elements is never displayed visually. The process of defining joins could be simplified. If you do not "import" (a misleading term for reading information from the data dictionary) foreign keys, you must create them when defining the joins. The tool advises against importing foreign keys for performance reasons, but if you don't, no joins are detected even when same column names are the same. The graphical representation of the physical model is not presented as a star schema; it's just a jumble of tables. Creating calculated items (price * quantity, for example) is possible, but poorly documented and buried beneath multiple menus (clicking an ellipse button from within a list of logical column mappings eventually invokes the desired expression editor).
|
Despite these issues, where the meta data layer is most powerful is in its ability to handle multiple schemas and to connect to multiple data sources that include relational (SQL Server, Teradata, etc.), multidimensional (Microsoft Analysis Services, SAP BW but not Essbase), XML, and even spreadsheets. Of leading BI products, only Cognos 8 and BusinessObjects XI with the Data Federator option provide such flexibility. In addition, Oracle BI EE can automatically handle both aggregate navigation and partitions, something only MicroStrategy can lay claim to and partially BusinessObjects (which handles aggregates but not partitions).
|
Oracle BI EE has an interesting and unique ability to present its meta data layer as an ODBC data source. In this approach, any end user tool – whether Microsoft Excel or Access or even competitive BI tools – can act as a front end to Oracle BI EE. This technical capability at first seemed to me more like competitive maneuvering on the vendor's part, yet in talking to customers, it makes practical and historical sense: Siebel Systems acquired this technology from nQuire in 2001. nQuire's initial goal was to provide federated data access, without alienating the more established BI vendors or telling customers to throw away their existing BI investments. While such capabilities still exist, I doubt such a happy co-existence of competitive BI tools would be widely used beyond Excel and Access.
Integrated Dashboards
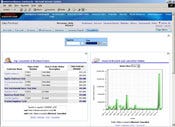
Users access Oracle BI EE through a Web-based portal and are normally presented with a dashboard view (see figure at right). The dashboards are based on individual reports built in Answers, and they nicely present multiple information elements in multiple formats (pivot table or chart). Each element in the dashboard is a portlet that users can further interact with to drill down, slice elements or modify. Whereas some dashboard design tools require IT, the Answers Dashboard Editor is ideal for power users to build dashboards. Dashboards can include a global prompt that affects the individual portlets; for example, in the screen shot at left, both the table and chart can be filtered by year. Using the Oracle Delivers module, the dashboard can also display alerts.
Oracle BI EE consists of the following modules:
|
While the dashboards are good, they do not include some advanced visualizations (heat maps, spark lines, small multiples, bullet graphs) and interactivity (such as sliders and push buttons) found in some pure-play dashboards.
For busy executives on the road, these Dashboards can be saved in their entirety to a PDF file (many tools only allow one portlet at a time). If customers buy the optional Disconnected Analytics (not tested), the entire dashboard is available offline with full interactive capabilities.
Business Query
Answers is the interface for business query and analysis. Users can build their own queries, and the ROLAP architecture provides for drill-down even with relational data sources. Hierarchy navigation is weak, though, with no indication of the drill path. Drill up is limited to the browser back button.
|
The query engine supports fairly sophisticated queries, with multiple SELECT statements, subqueries and nesting of filters. I liked the My Filters capability in which you can group multiple filters (Product=A, Region=New York, Year=2007) and save them for reuse in other queries. Users can build prompts into individual queries, but the prompting interface is dated, the process to build them convoluted, and cascaded prompts are not supported.
Once a query has executed, the results can be formatted in a table, pivot (crosstab), chart, or compound layout, but the report design process is one of the weaker aspects of the product. There are a number of idiosyncrasies. For example, users can sort measures in a table but not in a cross tab. A master/detail style report can contain a pivot but not a table. The charting engine lacks smarts and most default charts are unusable without first changing a number of default settings.
The toolbar icons are simply odd (and exceedingly small). A "pointing finger" button may invoke a formatting dialog or a properties dialog, yet within a pivot report, it is a "box with lines" icon that invokes a drop-down menu for formatting and adding calculations. To be fair, a number of vendors have struggled to replicate the Windows-like toolbar when products have been revamped for the Web, but Oracle BI EE has a longer way to go on intuitiveness.
One major usability shortcoming in the release I evaluated has since been addressed (in 10GR3). Namely, a new calculation editor lets users build report-based formulas via drop-downs (in the earlier version, users could create calculations, but they had to be hand-coded).
Bringing Hyperion into the Fold
With the acquisition of Hyperion just completed, it would be a glaring omission not to comment on where and how Hyperion's BI portfolio fits. While much of the thrust of the acquisition has focused on the value Hyperion's performance management modules, there are also a number of core BI capabilities that will enhance Oracle's BI product portfolio. Essbase will provide a powerful MOLAP engine and needs to be made accessible from the Oracle BI EE data model, which Oracle officials have said will be a priority. Beyond that, Oracle has been quiet about other BI products. In my opinion, Hyperion's Metrics Studio could add KPI capabilities to the dashboards, and at this point, Hyperion Smart View is stronger than the Oracle Office Plug-In.
Hyperion also could provide innovation and R&D skills in emerging BI capabilities that Oracle BI EE currently lacks, such as BI Search and Vista Gadgets. Clearly, how much Oracle leverages this knowledge capital will depend on which personnel stay and how much Oracle invests in BI. I've provided a more detailed analysis of overlapping product modules in a report on BIScorecard.com.
In the interim, given Oracle BI EE's powerful meta data layer and Web-based architecture, expect this to be the company's flagship product in the BI space. Whereas earlier BI efforts from Oracle were largely proprietary, Oracle BI EE brings an open solution that will compete more solidly against solutions from Business Objects and Cognos, but one that currently lags in usability.
• Oracle BI Enterprise Edition Suite is $1,500 per named user or $225,000 per processor. Customers may alternatively purchase individual modules.
Cindi Howson is the Founder of BIScorecard, a source for in-depth BI product reviews. Write to her at [email protected].
About the Author(s)
You May Also Like
More Insights
Webinars
How to Amplify DevOps with DevSecOps
May 22, 2024Generative AI: Use Cases and Risks in 2024
May 29, 2024Smart Service Management
June 4, 2024
Editor's Choice


May 2, 2024
While there are plentiful options in cyber resiliency and business continuity tools and platforms, there isn’t one that can knock out everything from sudden cloud outages to prolonged ransomware attacks in a single punch. What can you do to keep the company on its feet no matter what is thrown at it? Find out in this new virtual event.
Reserve Your Seat Now